
Cotality™, a leader in property information, analytics, and data‑enabled solutions, today released its Home Price Index™ with June 2026 data. Home price growth increased by 1.2% year-over-year and 0.3% month-over-month.
This press release features multimedia. View the full release here: https://www.businesswire.com/news/home/20260810466652/en/
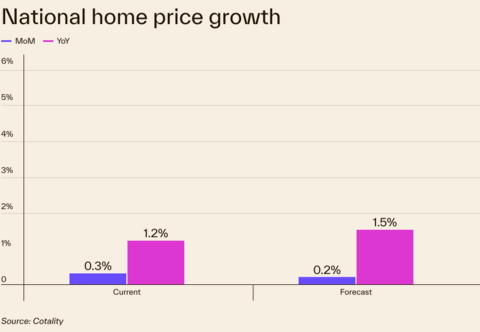
Cotality’s National Home Price Index for June 2026 and the forecasted year-over-year growth in 2027.
June data show a housing market that is no longer moving in one direction. Beneath the modest national gain, large metros are splitting into three groups: resilient Northeast and Midwest markets, still-cooling Sun Belt markets, and a growing set of markets where negative annual growth is beginning to stabilize.
Illinois saw the largest annual home price growth at 6.4% followed by Connecticut (6.0%), Nebraska and Indiana (both 5.8%), and Alaska (5.4%). Prices in the Northeast continue to rise, due to very few homes coming onto the market and a lack of new construction. Meanwhile, once hot locations in Texas and Colorado continue to see home prices drop, both saw -0.6% growth year-over-year. Among the top 100 metros, West Palm Beach-Boca Raton-Delray Beach, FL had the strongest acceleration in home price growth, followed by Washington, DC-MD and Greenville-Anderson-Greer, SC. Bridgeport-Stamford-Danbury, CT posted the strongest three-month HPI change at 6.1%, followed by Indianapolis-Carmel-Greenwood, IN and Lake County-Porter County-Jasper County, IN.
At the same time, weakness has not disappeared; it has become more concentrated. Rochester, NY continued to weaken, posting both the sharpest deceleration in annual growth and the weakest three-month HPI change. Dallas-Plano-Irving, TX; Austin-Round Rock-San Marcos, TX; Las Vegas-Henderson-North Las Vegas, NV; Tucson, AZ; Urban Honolulu, HI; and San Jose-Sunnyvale-Santa Clara, CA were also among the large markets showing weak or negative spring momentum.
“The June data show a market that is rebalancing, but not uniformly,” said Dr. Selma Hepp, Chief Economist at Cotality. “While the Midwest and Northeast continue to lead price growth, growing for-sale inventory is finally help release some of the pressure on those markets. In contrast, the rapid inventory buildup in parts of the South and West has slowed price growth and helped stabilize the price declines seen over the last year. We saw solid spring and early-summer price momentum despite higher mortgage rates, but that strength is likely to fade as inflation pressures, labor market weakness, and elevated borrowing costs weigh on prospective homebuyers.”
Cotality predicts the housing market to continue to be dictated by local job growth and industrial investments while mortgage rates remain elevated.
Top Takeaways:
- U.S. single-family home prices increased by 1.2% year over year in June 2026 compared with June 2025. On a month-over-month basis, home prices increased by 0.3% from May 2026.
- Cotality’s forecast shows annual U.S. home price gains increasing by 1.5% year-over-year in June 2027.
- For the fourth month, San Francisco posted the highest year-over-year home price increase of the country’s 100 largest metro areas in June, at 7.5%, tied with Bridgeport, CT. Chicago saw the third highest growth at 6.3%.
- Turnaround signals are emerging in 15 of the top 100 markets, where annual growth is still negative but recent momentum and the 2027 forecast are positive. These include Cape Coral-Fort Myers, FL; North Port-Bradenton-Sarasota, FL; Houston-Pasadena-The Woodlands, TX; Jacksonville, FL; St. Petersburg-Clearwater-Largo, FL; Tampa, FL; Las Vegas, NV; and Seattle-Bellevue-Kent, WA.
- Among states, Illinois saw the most annual growth in June, increasing by 6.4%. It was followed by Connecticut (6.0%), Nebraska (5.8%), Indiana (5.8%), and Alaska (5.4%).
- 38 states reached new high home price appreciation while 7 states showed negative home price appreciation in June 2026.
- The top markets at risk for price declines in the next 12 months, according to Cotality’s Market Risk Indicators include: Buffalo-Cheektowaga, NY; Cambridge-Newton-Framingham, MA; Providence-Warwick, RI-MA; Rochester, NY; and Worcester, MA.
- The metros identified as having the highest risk of home price declines are concentrated in the Northeast, where affordability has deteriorated significantly relative to local incomes. As local incomes have failed to keep pace with rising home values, these markets have become more vulnerable to price corrections.
We want to note Cotality’s models for the HPI forecast have been updated from HPIF v 4.6 to HPIF v5.0, incorporating enhancements designed to improve forecast accuracy and better reflect current housing market dynamics. As a result, forecast estimates may differ from those published in prior releases. The next Cotality Home Price Index will be released on September 8, 2026, featuring data for July 2026. For ongoing housing trends and data, visit the Cotality Insights blog: www.cotality.com/insights.
Methodology
The Cotality HPI™ is built on industry-leading public record, servicing, and securities real-estate databases and incorporates more than 50 years of repeat-sales transactions for analyzing home price trends. Generally released on the first Tuesday of each month with an average five-week lag, the Cotality HPI is designed to provide an early indication of home price trends by market segment and for the Single-Family Combined tier, representing the most comprehensive set of properties, including all sales for single-family attached and single-family detached properties. The indices are fully revised with each release and employ techniques to signal turning points sooner. The Cotality HPI provides measures for multiple market segments, referred to as tiers, based on property type, price, time between sales, loan type (conforming vs. non-conforming) and distressed sales. Broad national coverage is available from the national level down to ZIP Code, including non-disclosure states.
Cotality HPI Forecasts™ are based on a two-stage, error-correction econometric model that combines the equilibrium home price—as a function of real disposable income per capita and housing supply constraints—with short-run fluctuations caused by market momentum, mean-reversion, and exogenous economic shocks like changes in the unemployment rate. With a 30-year forecast horizon, Cotality HPI Forecasts project Cotality HPI levels for two tiers — Single-Family Combined (both attached and detached) and Single-Family Combined Excluding Distressed Sales. As a companion to the Cotality HPI Forecasts, Stress-Testing Scenarios align with Comprehensive Capital Analysis and Review (CCAR) national scenarios to project five years of home prices under baseline, and severely adverse scenarios at state, metropolitan areas and ZIP Code levels.
About Market Risk Indicators
Market Risk Indicators are a subscription-based analytics solution that provide monthly updates on the overall health of housing markets across the country. Cotality data scientists combine world-class analytics with detailed economic and housing data to help determine the likelihood of a housing bubble burst in 400+ major metros and all 50 states. Market Risk Indicators is a multi-phase regression model that provides a probability score (from 1 to 100) on the likelihood of two scenarios per metro: a >10% price reduction and a ≤ 10% price reduction. The higher the score, the higher the risk of a price reduction.
About the Market Condition Indicators
As part of the Cotality HPI and HPI Forecasts offerings, Market Condition Indicators are available at the state, metropolitan area and county levels, identifying individual markets as overvalued, at value or undervalued. These indicators are derived from the long-term fundamental values, which are a function of real disposable income per capita and housing supply constraints. Markets are labeled as overvalued if the current home price indexes exceed their long-term values by greater than 10% and undervalued where the long-term values exceed the index levels by greater than 10%.
The data provided are for use only by the primary recipient or the primary recipient’s publication or broadcast. This data should not be resold, republished or licensed to any other source, including publications and sources owned by the primary recipient’s parent company without prior written permission from Cotality. Any Cotality data used for publication or broadcast, in whole or in part, must be sourced as coming from Cotality, a data and analytics company. For use with broadcast or web content, the citation must directly accompany first reference of the data. If the data are illustrated with maps, charts, graphs, or other visual elements, the Cotality logo must be included on screen or website. For questions, analysis or interpretation of the data, contact Charity Head at newsmedia@Cotality.com. Data provided should not be modified without the prior written permission of Cotality. Do not use the data in any unlawful manner. The data are compiled from public records, contributory databases and proprietary analytics, and its accuracy is dependent upon these sources.
About Cotality
Cotality accelerates data, insights, and workflows across the property ecosystem to enable industry professionals to surpass their ambitions and impact society. With billions of real-time data signals across the life cycle of a property, we unearth hidden risks and transformative opportunities for agents, lenders, carriers, and innovators. Get to know us at www.cotality.com.
View source version on businesswire.com: https://www.businesswire.com/news/home/20260810466652/en/
Media gallery


